1 Introduction
The spherical photometer is an efficient and fast device for measuring the luminous flux and light efficiency of LED products. It is the measuring instrument for luminous flux measurement, product testing center and enterprise quality control department. It is the most important equipment for LED luminous flux and light efficiency detection [1] ]. How to properly use a spherical photometer to obtain accurate luminous flux values ​​is a common concern of testers. This article will attempt to discuss the key technical points of the spherical photometer to measure the total luminous flux of LEDs.
2 spherical photometer principle
The spherical photometer is a photometer that uses the integrating sphere to measure the total luminous flux of the light source. The basic structure is shown in Figure 1. The light source S is placed in the integrating sphere (common position is the 4Ï€ measurement mode of the ball center position, or the 2Ï€ measurement mode near the ball wall), and the optical probe D is attached to the detection hole on the ball wall. The hole is on the wall of the ball and a diffuser is placed. If the probe D is a photometric probe, its output current is converted into a voltage by I/V, and finally displayed on the reading meter R; if the probe D is a fiber collecting surface, the light is collected and then connected to the spectroradiometer through the optical fiber, according to the measured The spectral power in the visible region is calculated using the spectral luminous efficiency function to calculate the total luminous flux. There is also a combination of the two, that is, using a photometric probe and a spectroradiometer, using a photometric probe to measure the luminous flux, and a spectroradiometer to measure the spectral power distribution of the light source.
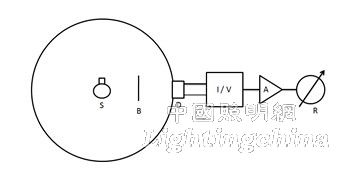
Figure 1a. Schematic diagram of a spherical photometer (detection system is an illuminometer)
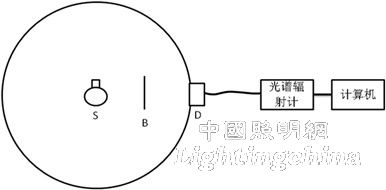
Figure 1b. Schematic diagram of a spherical photometer (probe system is a spectroradiometer)
The inside of the integrating sphere is uniformly coated with a white diffuse reflective material. The material requires good diffuse reflection characteristics and no spectral selectivity. Let the reflection of the ball wall be Ï, the radius of the ball is R, and the total luminous flux emitted by the light source S is φ. According to the integrating sphere theory, the reflected illuminance of the light source S on the ball wall is

For a certain integrating sphere, both R and Ï are fixed. Therefore, the above formula indicates that the indirect illuminance values ​​formed by the light source at each point on the inner wall of the ball are equal due to the multiple diffuse reflection of the inner wall of the integrating sphere, and are proportional to the total luminous flux of the light source. In Fig. 1, the function of the baffle B is to block the light source S from directly illuminating the probe D. If the baffle B is removed from the integrating sphere, the light emitted from the light source will directly illuminate the probe D. At this time, the illuminance at the position of the probe D will depend on the luminous intensity of the light source in this direction. The illuminance values ​​at the points on the inner wall of the ball are not equal and will not be proportional to the total luminous flux of the light source.
According to formula (1), we can measure the total luminous flux of the measured lamp by comparing the photoelectric reading between the measured lamp and the standard lamp.
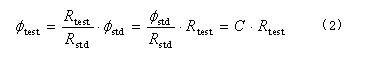
Where Rtest is the photoelectric reading of the lamp under test, Rstd is the photoelectric reading of the standard lamp, φstd is the total luminous flux value of the standard lamp, and C is the luminous flux constant.
3 LED features
LED is a new generation of energy-saving light source, featuring high efficiency, long life, rich color and large dynamic adjustment range. It is highly concerned by the people and is also a high-tech product for the government to achieve energy saving and emission reduction [2]. It is generally believed that LED lamps have the following characteristics compared to conventional incandescent lamps [3]:
1) The color temperature and the spectral difference are large. A typical white LED is a yellow-green phosphor that is excited by blue light and mixed to obtain a white color. As shown below:
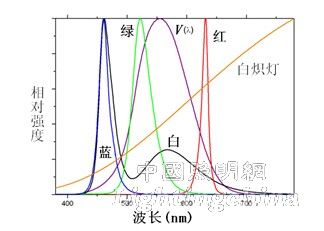
Figure 2. Luminescence spectrum of a typical LED and incandescent lamp
This feature makes the spectral photo-efficiency function mismatch correction required for the measurement of the spherical photometer.
2) The space is not uniformly illuminated. Individual types of LEDs have strong directionality, and the spatial luminous intensity distribution curve is clearly different from incandescent lamps. This feature makes it necessary to introduce an integrating sphere spatial response function when measuring a spherical photometer.
3) The influence of the junction temperature is large. Since the LED light-emitting chip depends on the PN junction temperature, the LED light flux is affected by the ambient temperature, heat dissipation conditions, and warm-up time. Incandescent lamps only take about 5 minutes and are close to heat balance and are not sensitive to ambient temperature. This feature makes it necessary to fully preheat the measured LED flux and maintain a specified ignition attitude and ambient temperature.
4 Key technical points for measuring total luminous flux of LED
1) The standard lamp used is reliable and its verification or calibration certificate is valid.
At present, the standard lamps used in China are BDT and BDP standard incandescent lamps. These types of standard lamps are stable and reliable, and can accurately calibrate the luminous flux readings. In addition, the high temperature temperature distributed temperature standard lamp spectrum covers the visible light region, which can effectively calibrate the radiation spectrometer in the spherical photometer.
2) Good laboratory environment and sufficient warm-up time to improve the repeatability of LED values.
Since LEDs are susceptible to ambient temperature, clean, constant temperature laboratory conditions are required. According to the author's daily experience in measuring LED light source, in order to achieve thermal balance, the LED single tube warm-up time is 5 minutes, and the LED bulb and other light sources take 0.5 hours to 1 hour. The fully aged and selected LED source repeatability has reached 0.5%.
3) Good equipment characteristics.
In order to bring the actually used integrating sphere close to the ideal condition, the integrating sphere diameter should be as large as possible in the case of satisfying the sensitivity requirements of the photometric probe. The inner sphere coating material should be clean and uniform, and the reflectivity meets the requirements of CIE 84-1989 The measurement of luminous flux; the internal brackets and fixtures must not obstruct the lamp, spray a diffuse coating and have a small overall surface area. The position of the screen is appropriate and the area under which the measured light source does not directly illuminate the detector. The photometric detector has good performance. If it is a photometric probe with V(λ) correction, it needs f1' to be small enough (laboratory level); if the photometric detector is a radiation spectrometer, the stray light is required to be small, and the wavelength position error is small. The dynamic range is large and the linearity is good.
4) Spectral optical efficiency function mismatch correction [4, 5].
When the detector is a photometric probe, the actual responsivity curve differs from the ideal spectral luminous efficiency function V(λ). In addition, the diffuse reflection coating inside the integrating sphere and the frosted glass at the window are not ideally flat curves. These factors cause the response curve of the spherical photometer to deviate from V(λ), resulting in a V(λ) mismatch error. The measurement deviation can be estimated by the following calculations and mismatch corrections are made:
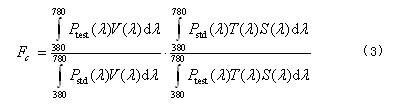
among them 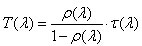 Ptest(λ) is the relative optical power distribution of the lamp under test, Pstd(λ) is the relative spectral power distribution of the standard lamp, S(λ) is the relative spectral responsivity of the photometric system, and Ï(λ) is the inner wall of the integrating sphere. The spectral diffuse reflectance, Ï„(λ) is the spectral diffuse transmittance of the frosted glass at the integrating sphere window. For example, if a spherical photometer is used to calibrate a spherical photometer with a BDP, the correction factor is 1.01; if the blue LED is measured, the coefficient may be 1.10 or even higher.
5) The integral sphere spatial response function is modified [4, 5].
When there is a significant difference in the spatial distribution curve of the normalized light intensity of the LED to be tested and the standard lamp, special attention should be paid to the correction factor. Due to the uneven internal coating of the spherical photometer and the presence of internal components (such as screens), the illuminance values ​​formed on the detectors in different regions of the inner sphere wall of the integrating sphere are not equal, that is, there is unevenness. The spatial response distribution function (SRDF) of the integrating sphere:
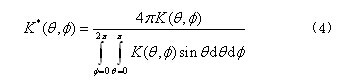
K(θ, φ) represents the projection of the detector after a large number of diffuse reflections on the inner wall of the sphere (θ, φ) from the center of the sphere in the integrating sphere. Generally, K(0,0) can be set to unit 1.
The integral sphere spatial response distribution function correction factor can be written as:
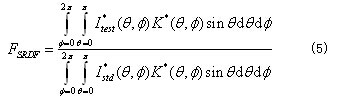
Itest (θ, φ) and Istd (θ, φ) represent the spatial distribution curve of the normalized light intensity of the LED under test and the standard lamp, respectively. It can be known from formula (5) that if the internal space response of the integrating sphere is obviously uneven (such as partial coating yellowing, bottom ash accumulation, large light barrier area, etc.), and the spatial distribution curve of the measured light intensity of the LED lamp and the standard lamp If the difference is obvious, the above correction factor may be relatively large. For example, if you use BDP to calibrate a spherical photometer and then measure an LED spotlight, the correction factor may be as high as 1.10.
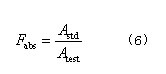
6) Self-absorption correction [4, 5].
When the measured LED and the standard lamp have large differences in size or a significant difference in state, the absorption correction factor should be calculated. An illuminating stable auxiliary light is ignited at an appropriate position in the integrating sphere (generally on the wall of the ball) and blocks its direct light directed toward the window and the lamp under test. Place a standard lamp at the position where the light source is normally installed. The detector reads Astd; remove the standard lamp, place the LED under test in the same position, and the detector reading is Atest. The absorption correction factor is calculated as:
7) Use the LED value to transmit the reference lamp to avoid the above correction, making the measurement process simple and reliable [6].
If the measured lamp and the standard lamp are close to each other in terms of total luminous flux, normalized light intensity spatial distribution curve, and illuminating spectrum, the above three correction coefficients are all close to 1 and can be ignored. It is recommended to consider the selection of a series of stable LED transmission standard lamps, directly using the formula (2) to calculate the luminous flux value.
5 Summary
In general, if the spherical photometer meets the hardware requirements mentioned above, the operator can keep the integrating sphere clean, and pay attention to the optical characteristics of the measured lamp and the standard lamp (or LED value transfer reference lamp), The total luminous flux result error of the measured LED lamp is fully controllable. When the spectrum of the measured lamp and the standard lamp (or the LED value transmission reference lamp) have large differences in the spatial distribution or shape of the light intensity, corresponding corrections are needed to reduce the measurement uncertainty.
Acknowledgement: Thanks to Yang Chenzhu for his helpful advice and selfless help in the measurement technology of spherical photometer.
Edit: Cedar
Qunsuo is a professional manufacturer of Barcode Scanner. We provide 1D Barcode Scanner and Qr Code Scanner , help customers from various industries. All of our barcode scanner support connecting with Android IOS via bluetooth. Furthermore, Our barcode scanner also support connecting with PC via 2.4G wireless module. Qunsuo provide portable scanner, Finger Barcode Scanner and Handheld Barcode Scanner. And our QS-S03 is equipped with Zebra scanner engine. If any interests, please feel free to send inquiry to us for more information.

Barcode Scanner
2D Barcode Scanner,Free Barcode Scanner,Finger Barcode Scanner,Barcode Scanner Android
Shenzhen Qunsuo Technology Co., Ltd , https://www.qsprinter.com